Skeleton to create fast automatic tree diagrams using R and Graphviz
I've had to create tree diagrams (dendrograms, decision trees) many times in the past to illustrate the flow of data or decisions (e.g., data flow for a study). This is usually a manual task done in MS Powerpoint or Visio. I've also made some diagrams in the past using Graphviz based on the DOT language to make creation more reproducible. However, that still felt pretty manual.
I decided to come up with a skeleton framework to generate these diagrams using R since I could connect to various data sources, do calculations, and mash up outputs fairly fast with it.
Here is my framework illustrated by an example:
```{r}
digraph <- '# dot -Tpng diagram.gv > diagram.png
digraph g {
graph [rankdir="LR"]
node [shape="rectangle" style=filled color=blue fontcolor=white] ;
n [label="%s"] ;
n_a [label="%s" color=red] ;
n_b [label="%s"] ;
n_aa [label="%s" color=red] ;
n_ab [label="%s" color=red] ;
n_ba [label="%s"] ;
n_bb [label="%s"] ;
n -> n_a [label="%s"];
n -> n_b [label="%s"];
n_a -> n_aa [label="%s"];
n_a -> n_ab [label="%s"];
n_b -> n_ba [label="%s"] ;
n_b -> n_bb [label="%s"] ;
}
'

string_list <- list(
    digraph
    , 'All calls\\nn=100,000'
    , 'Night\\nn=20,000'
    , 'Day\\nn=80,000'
    , 'Closed\\nn=5,000'
    , 'Open\\nn=15,000'
    , 'Closed\\nn=10,000'
    , 'Open\\nn=7,000'
    , 'Night'
    , 'Day'
    , 'Closed'
    , 'Open'
    , 'Closed'
    , 'Open'
    )

# http://stackoverflow.com/questions/10341114/alternative-function-to-paste
dot_file <- do.call(sprintf, string_list)
sink('diagram.gv', split=TRUE)
cat(dot_file)
sink()
# run: dot -Tpng diagram.gv > diagram.png
```
This will write a file called diagram.gv:
# dot -Tpng diagram.gv > diagram.png
digraph g {
graph [rankdir="LR"]
node [shape="rectangle" style=filled color=blue fontcolor=white] ;
n [label="All calls\nn=100,000"] ;
n_a [label="Night\nn=20,000" color=red] ;
n_b [label="Day\nn=80,000"] ;
n_aa [label="Closed\nn=5,000" color=red] ;
n_ab [label="Open\nn=15,000" color=red] ;
n_ba [label="Closed\nn=10,000"] ;
n_bb [label="Open\nn=7,000"] ;
n -> n_a [label="Night"];
n -> n_b [label="Day"];
n_a -> n_aa [label="Closed"];
n_a -> n_ab [label="Open"];
n_b -> n_ba [label="Closed"] ;
n_b -> n_bb [label="Open"] ;
}
Executing dot -Tpng diagram.gv > diagram.png, I will get the following output:
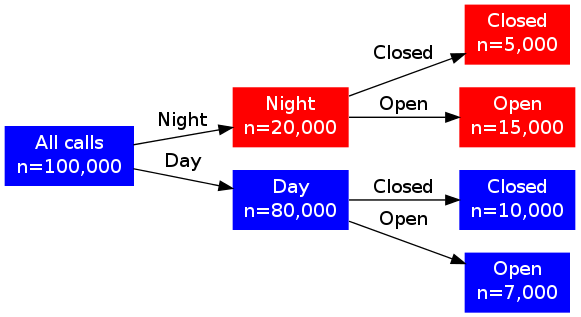
To make tree diagrams quickly, edit the structure of the diagram stored in the variable digraph. Dynamic texts should be inserted using sprintf via the list string_list. For example, do all calculations and then format the results in string_list. Then the diagram could be generated very quickly and will be reproducible. Changing any data source or any calculations would not result in manually re-creating the diagram!